Mind you, the daily chart of the S&P 500 shows a bullish uptrend:
 |
| Source: Stockcharts.com |
The Index broke out of a rising wedge last month, an occurrence that is quite rare according to Tom Bulkowski's web site where he cites the breakout for rising wedges is down 69% of the time. Support now resides at the upper boundary of the wedge (1750), followed by the prior high of 1725 in September, and then the high in early August combined with the 50-day moving average, both at around 1700.
The hourly chart of the S&P 500 has me concerned:

Note during the rally in the latter half of last month, the rise went parabolic, with trend lines becoming increasingly steep. The ascent broke down on October 30th, followed by the Index trying to rally only to fail. Again, keep in mind this is an hourly chart with its implications being very near-term.
Other indications for an imminent pause include small-cap vs. large-cap performance:
 |
| Source: Stockcharts.com |
In the chart above, the lower inset shows the IWM vs. SPY relative return and it recently broke an uptrend and has not been able to make a new high with the S&P 500 (upper inset).
Another related indication is high-yield bonds vs. T-bonds:
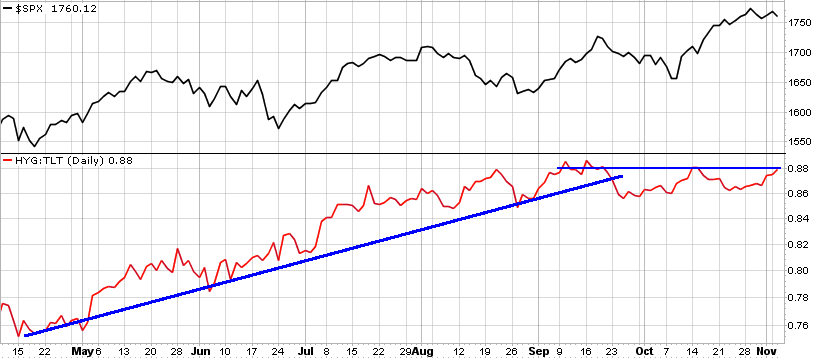
The lower inset depicts the relative return of high-yield bonds vs. T-bonds with the uptrend broken in September and relative performance stalling, not yet confirming the stock market's new high.
Finally, cyclicals vs. staples exhibits a similar picture:

The relative return of cyclical stocks vs. staples broke its uptrend last month and has yet to make a new high.
In sum, all three risk-on/risk-off metrics (cap size, fixed-income quality, cyclical/non-cyclical equities) have not (yet) confirmed the S&P 500's new high, suggesting risk-off sentiment could be taking hold which would further suggest a pause is in the cards. A pullback to 1725 is a 2.5% correction from the peak, and to 1700 is 4% off the peak, nothing cataclysmic or overly alarming. And as I wrote in my last post, "the overbought condition can be worked off via time rather than price, meaning a sideways consolidation could do the job as opposed to a decline."
Today Indian Stock market traded in both color, Nifty took support of 6215.0 level and recover intraday loses, market updates by technical visit here FREE NIFTY TIPS and TOMORROW STOCK TIPS
ReplyDeleteAs the prediction market come under in pressure now market under the red color we may more fall off in market in upcoming days..... get more about market click on FREE STOCK TIPS Tomorrow
ReplyDeleteand TODAY STOCK TIPS by nisha dubey